See the Cumulative Impacts
VIEW A MAP OF 2021 SPRAYS AND CLEAR CUTS ACROSS OREGON, created using the publicly available FERNS data.
If you are a GIS user, you can also download the shapefiles (updated weekly) from the Oregon Department of Forestry’s spatial data website.
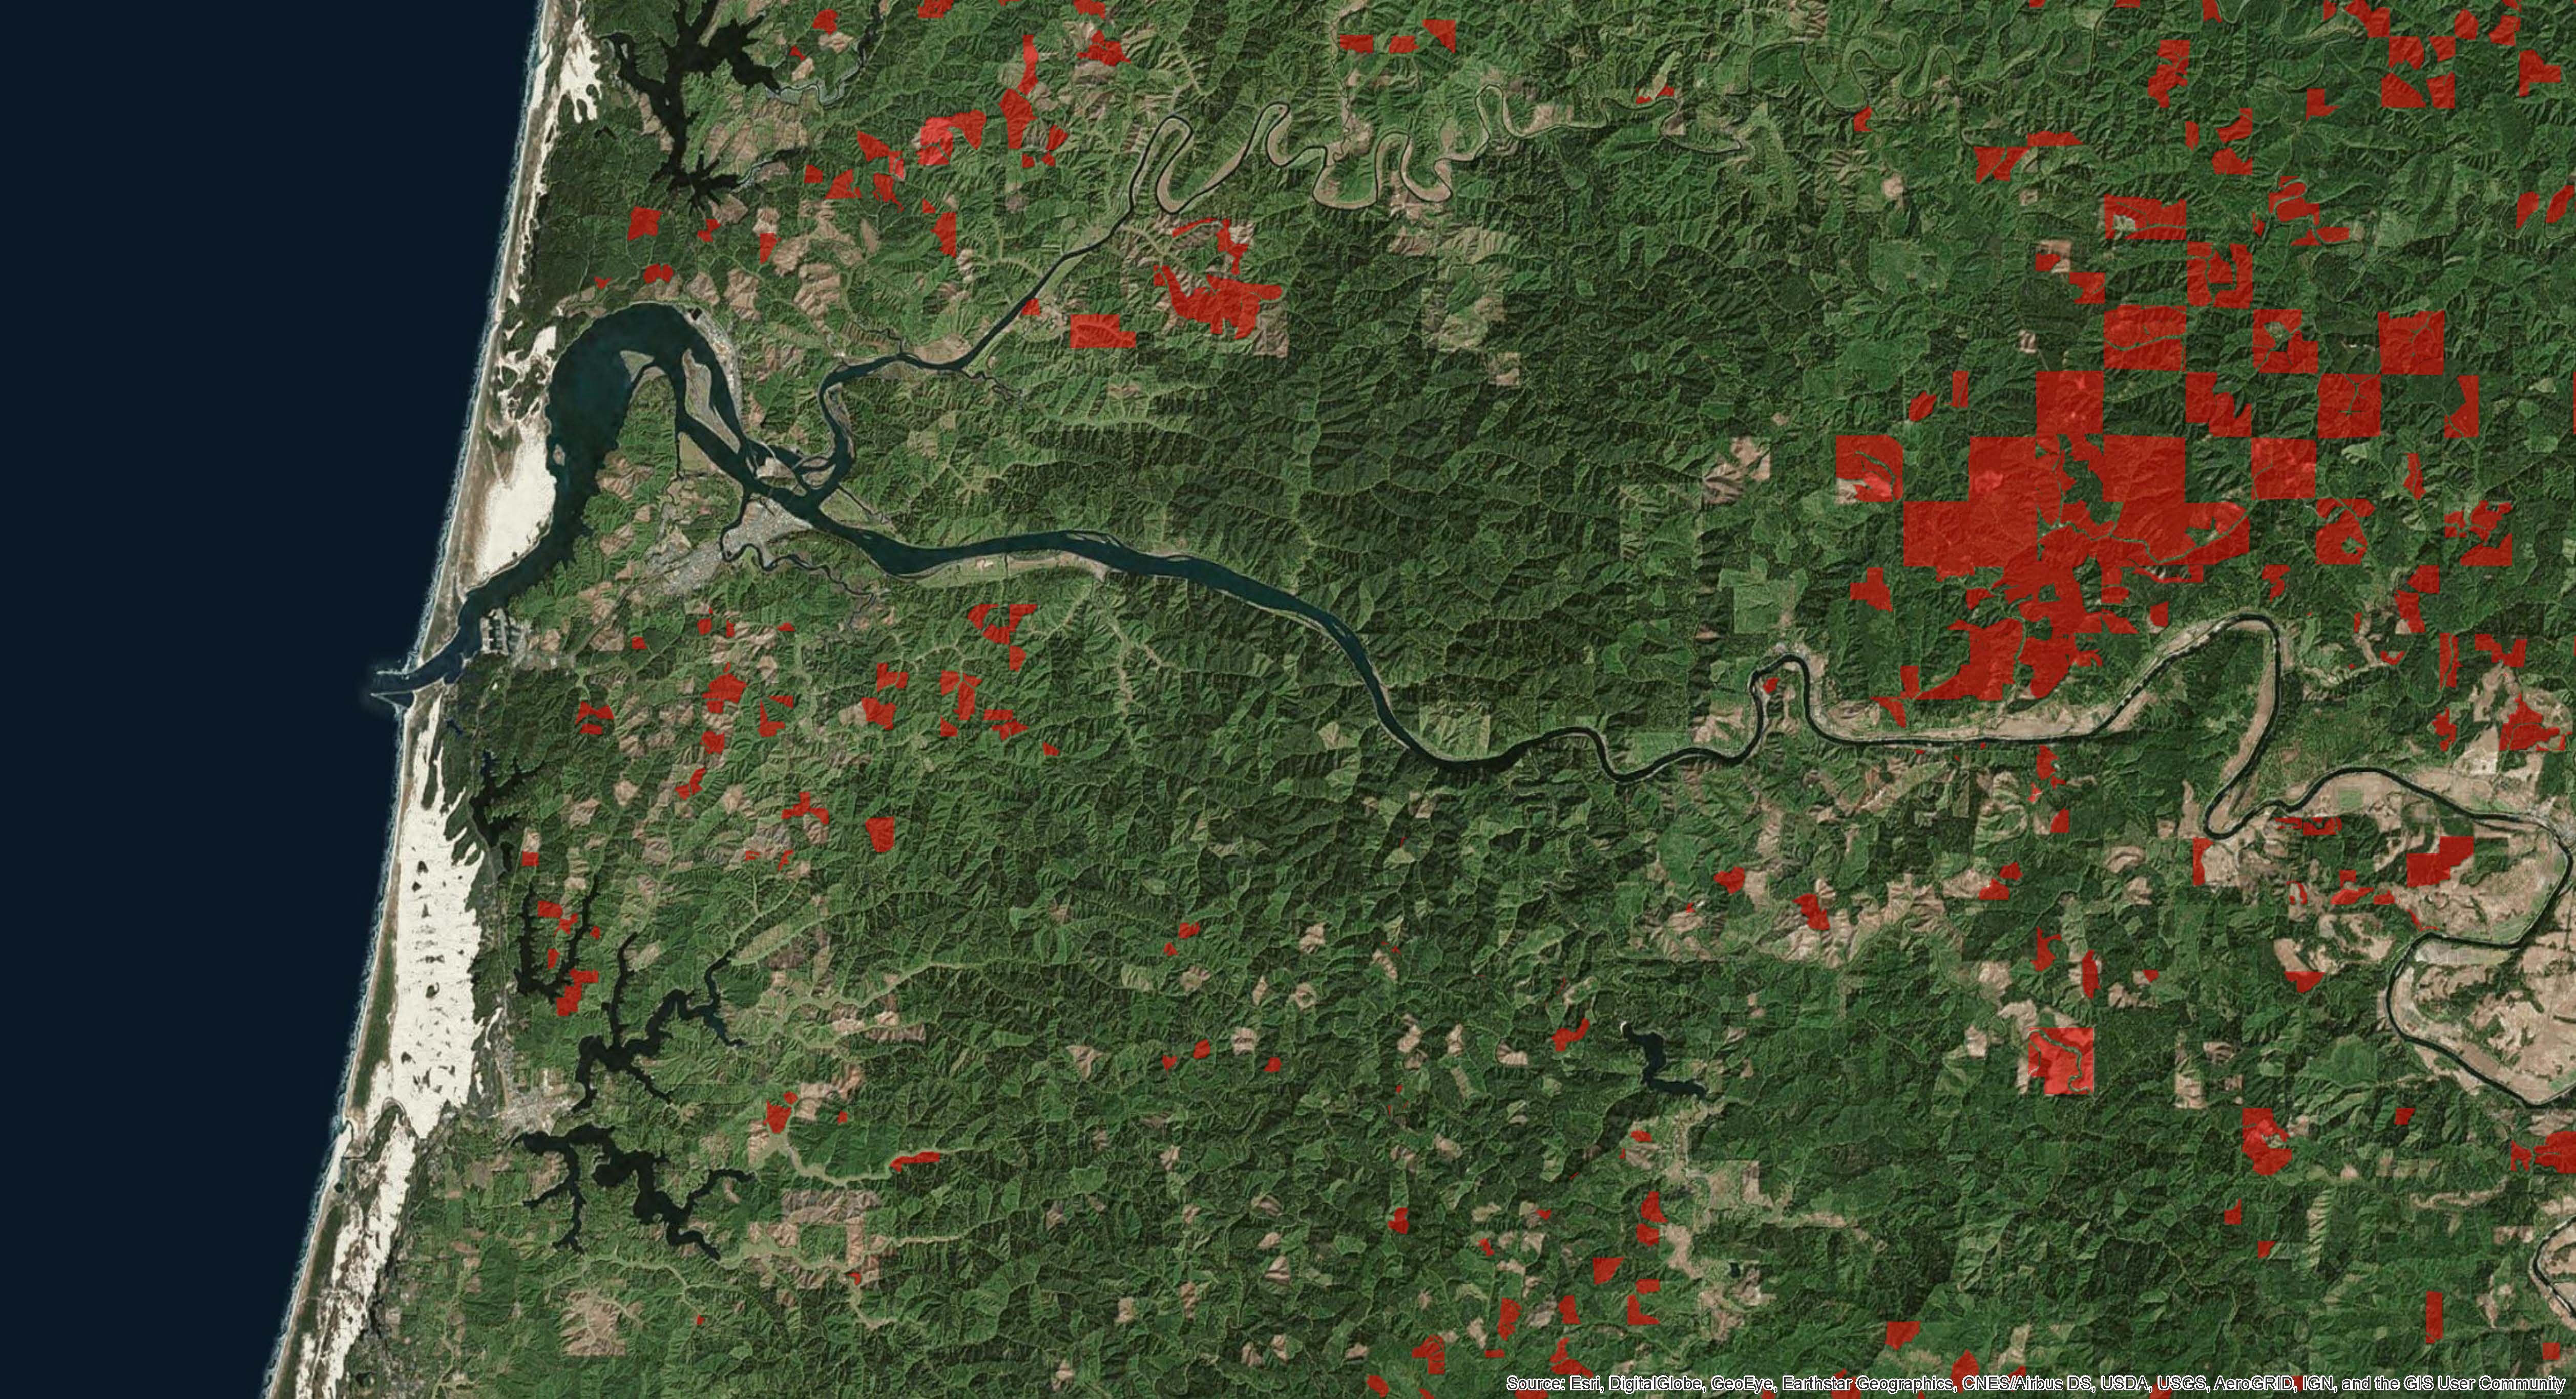
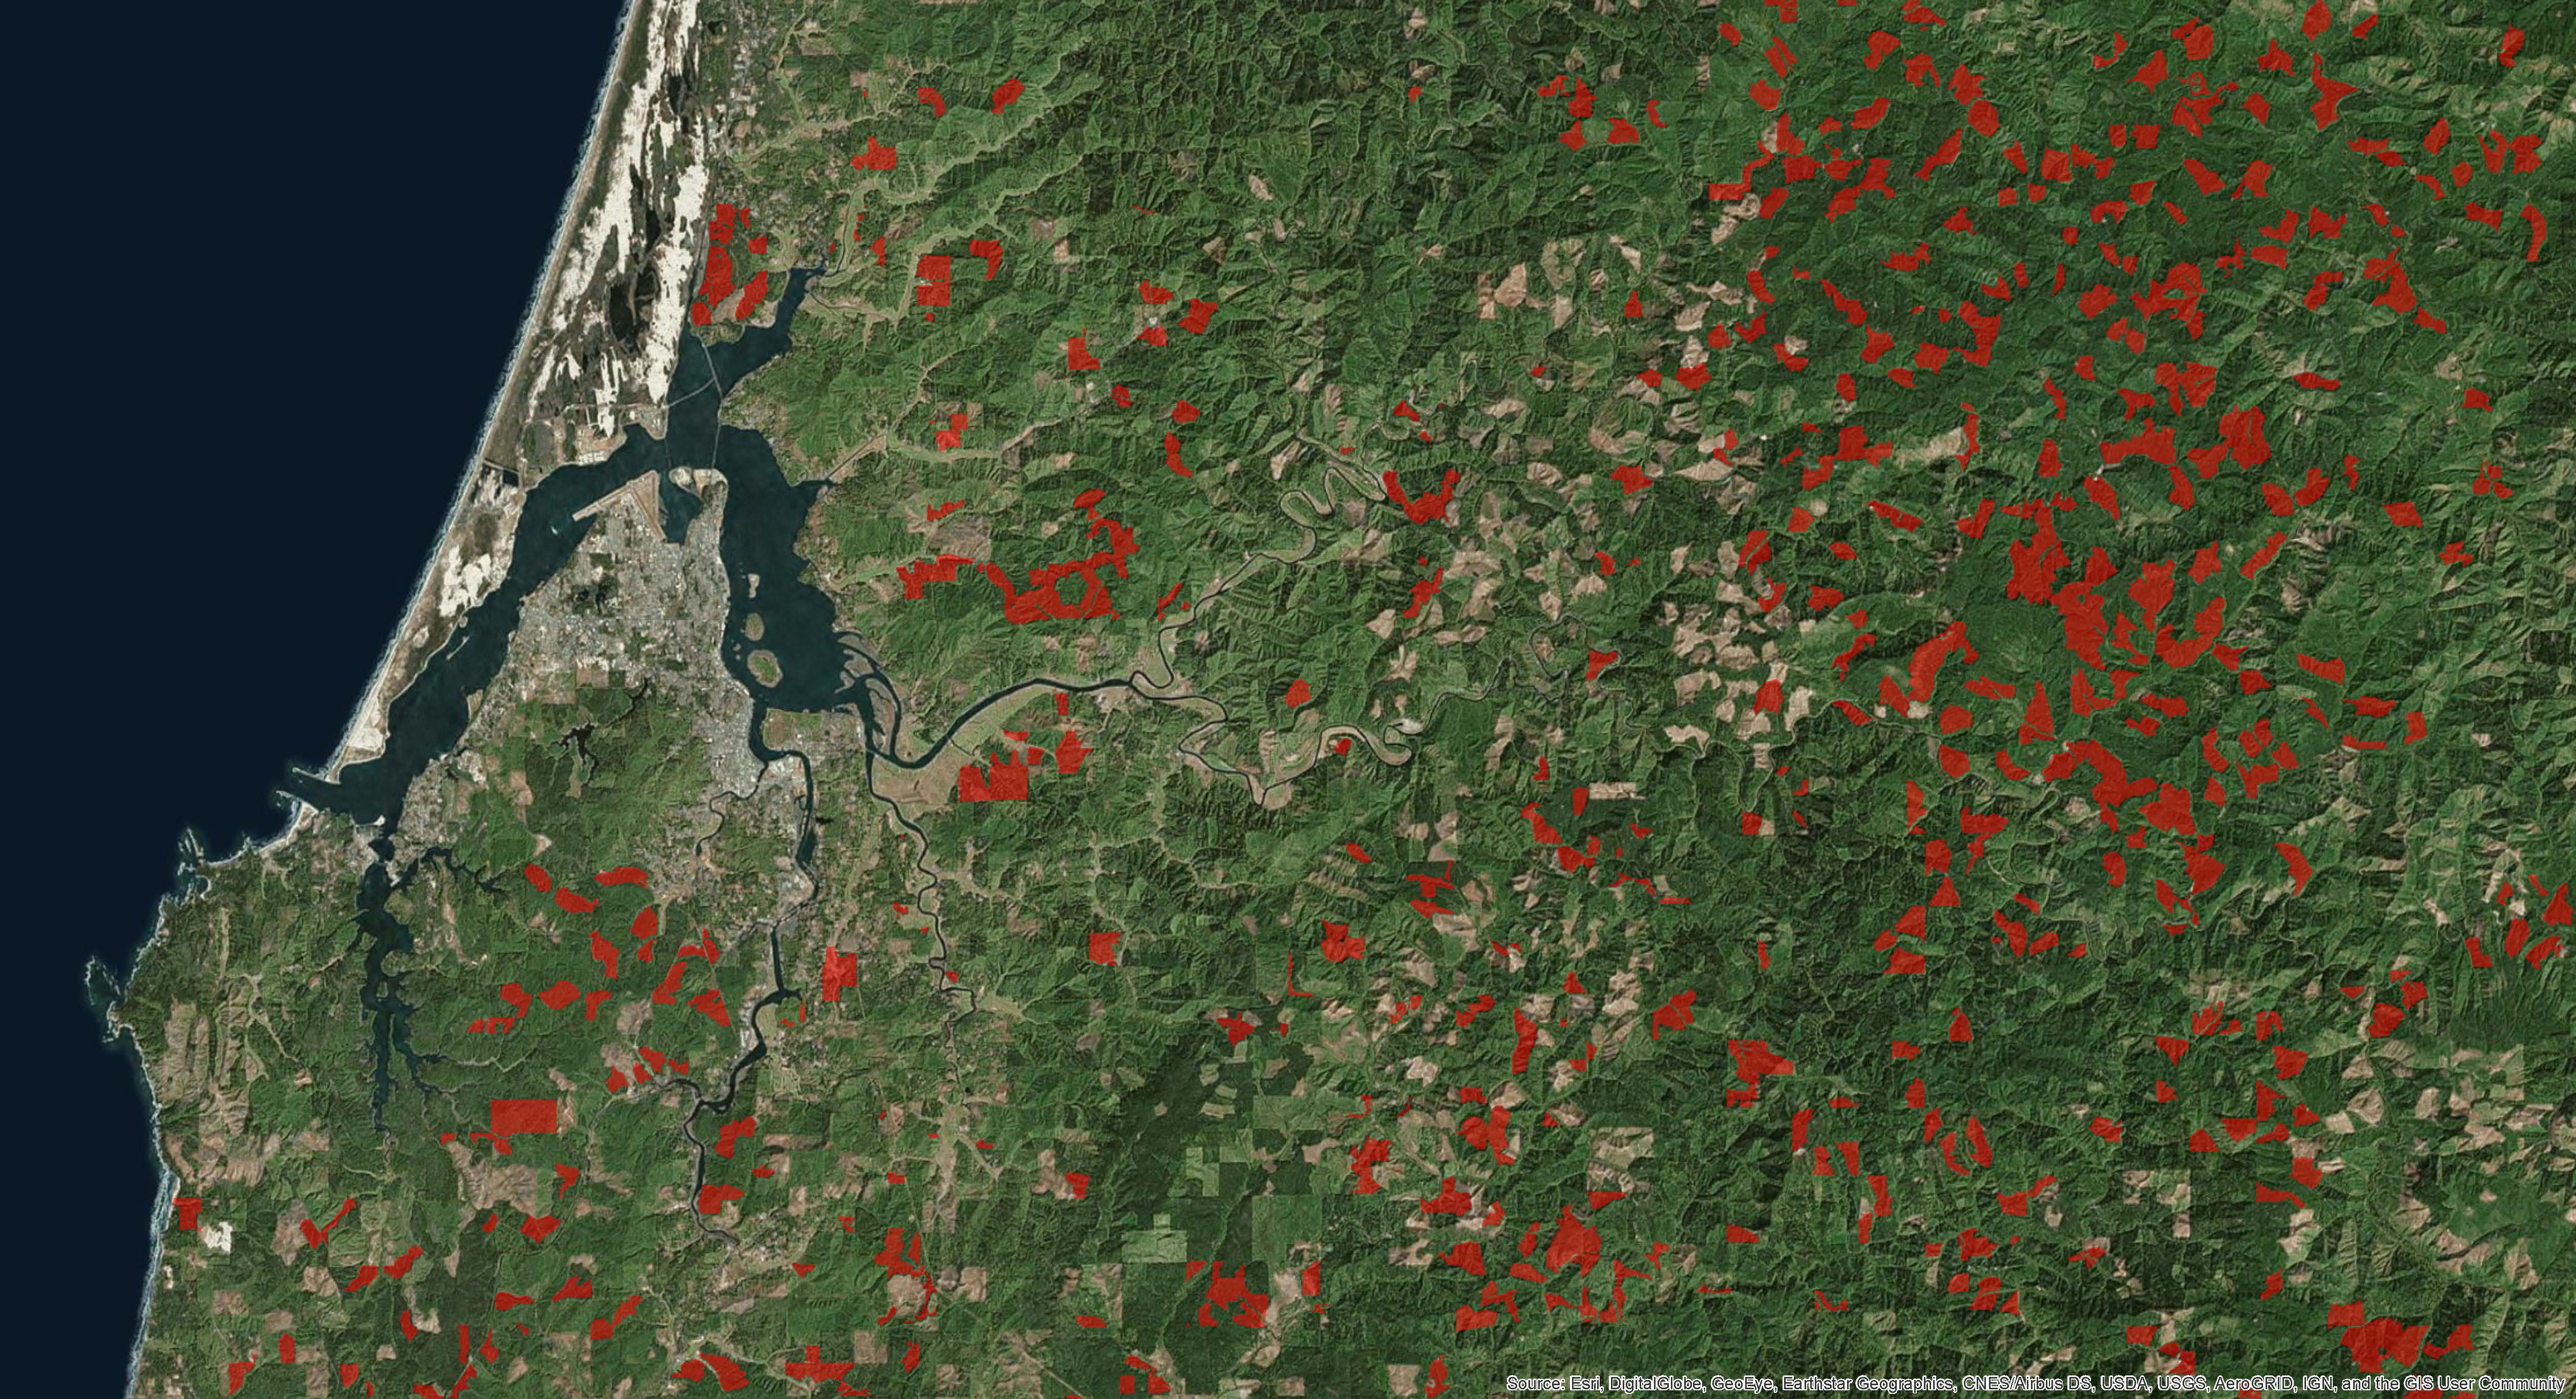
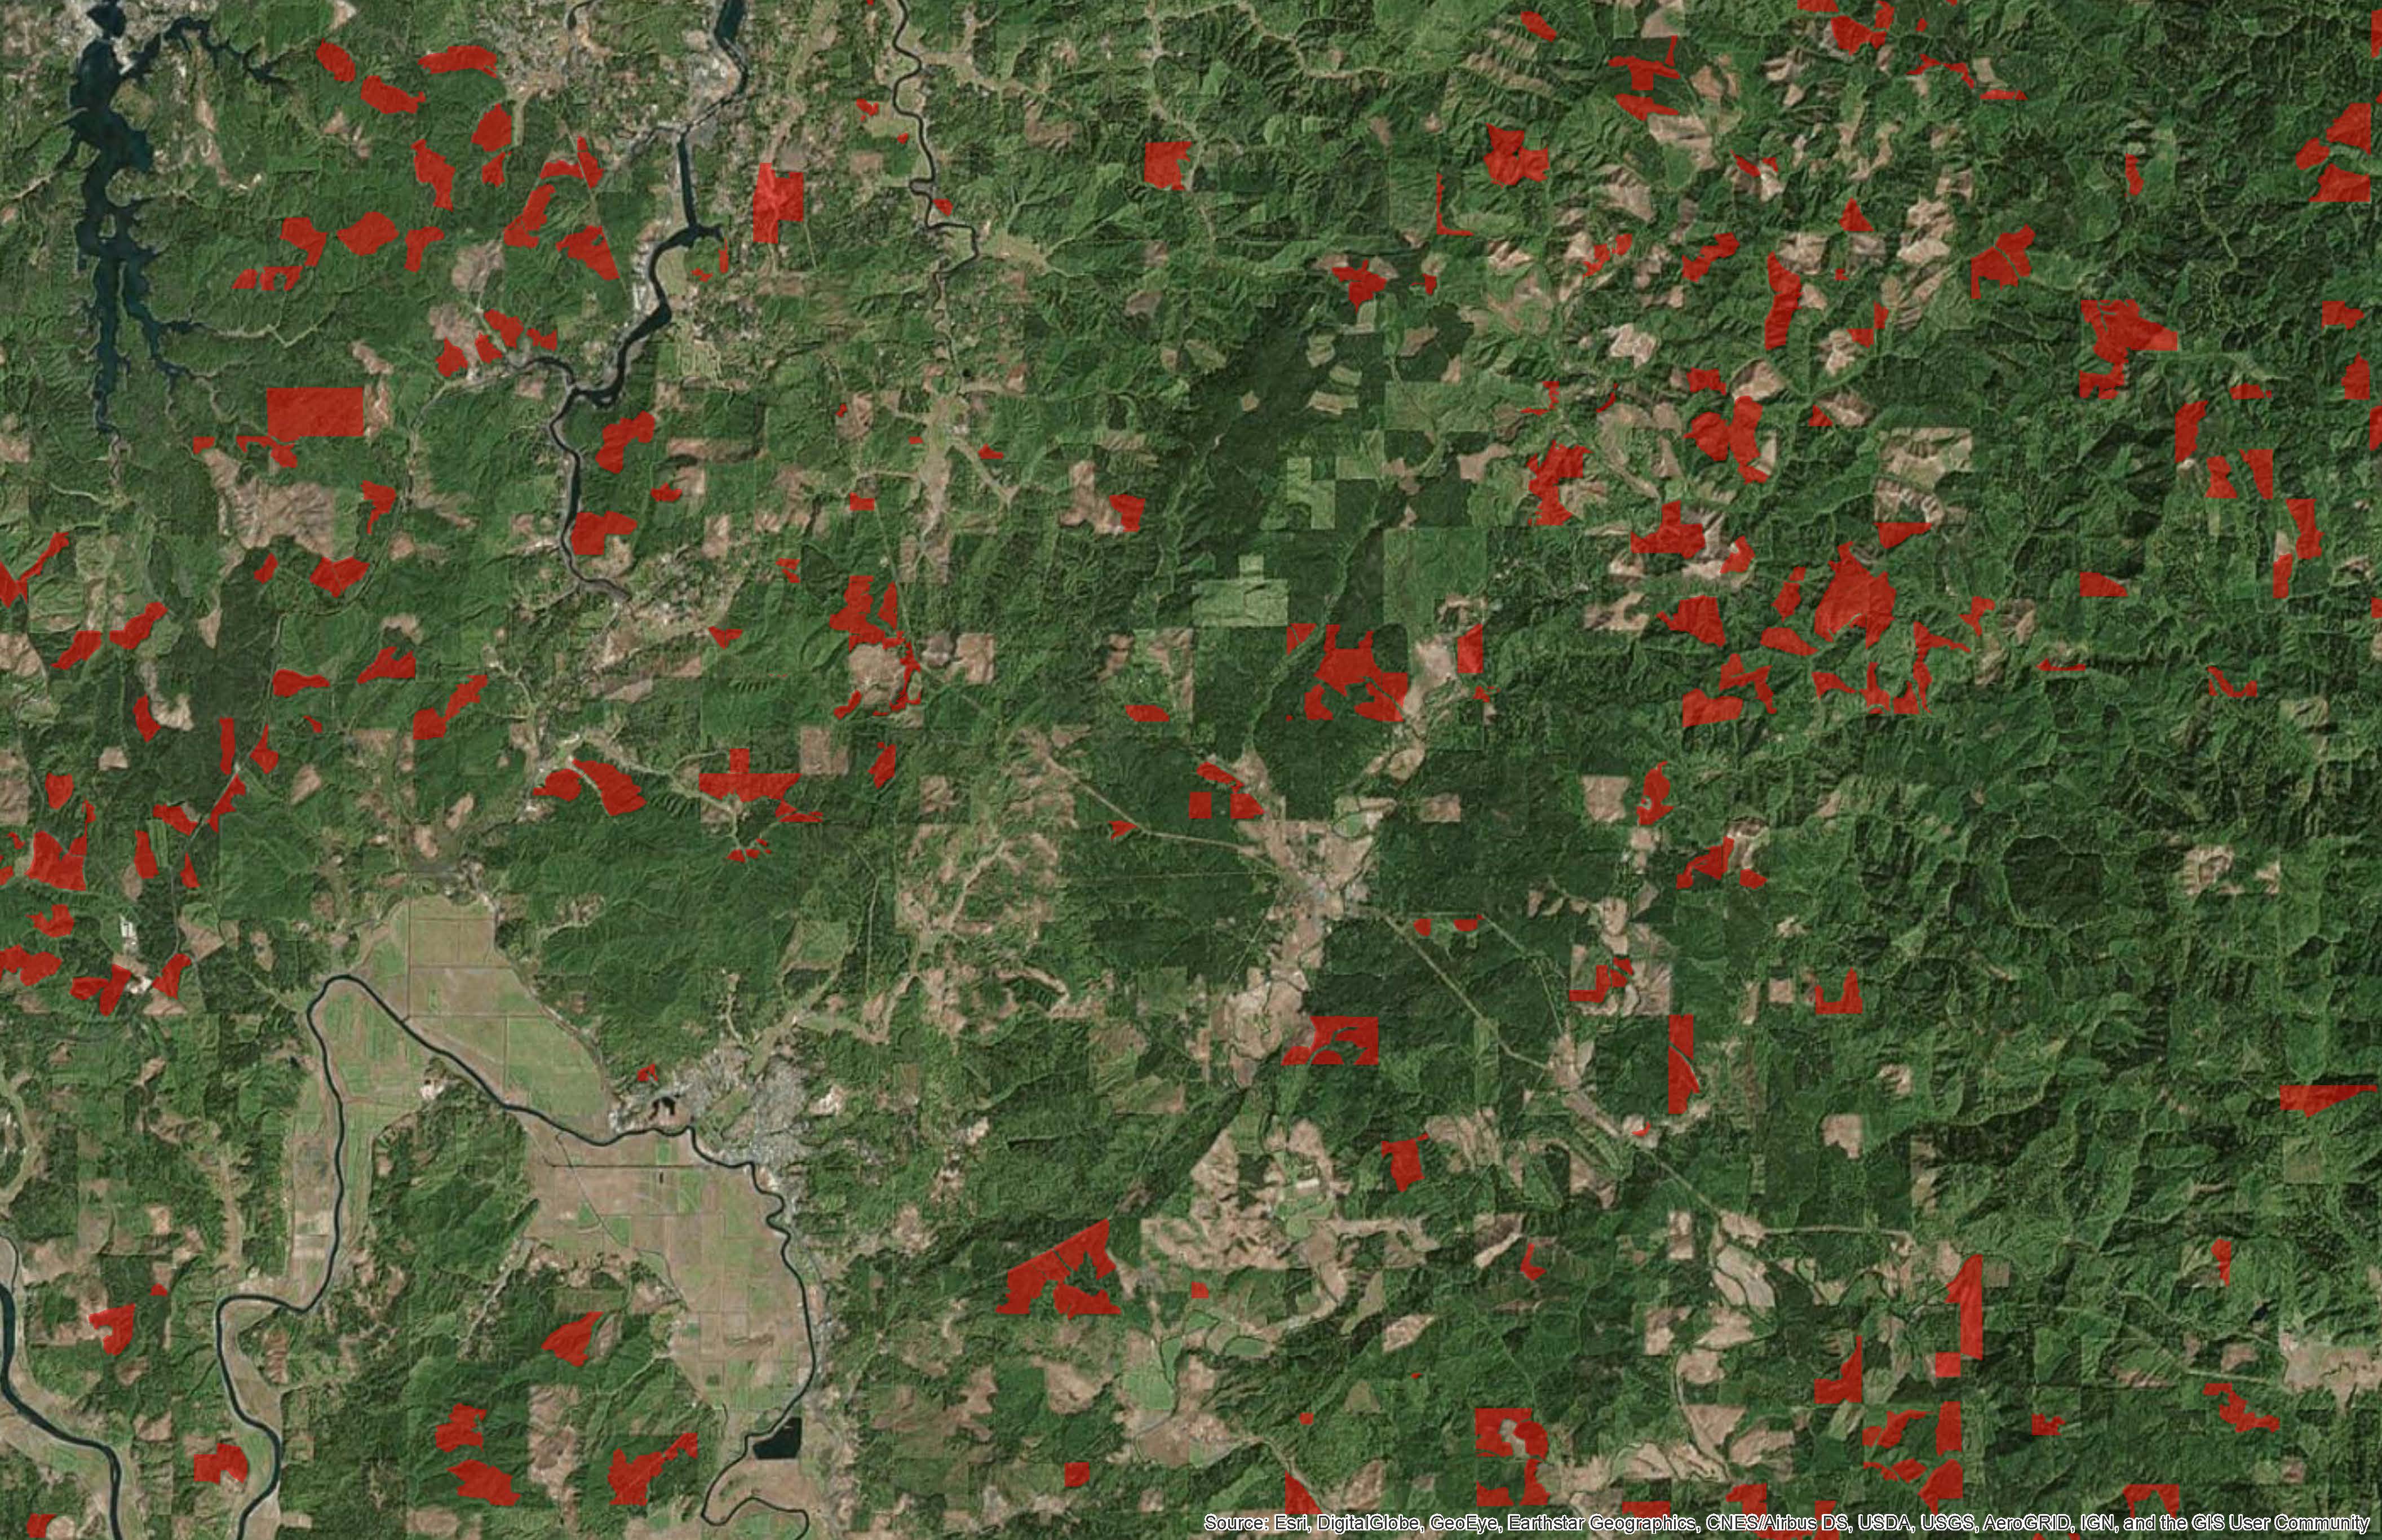
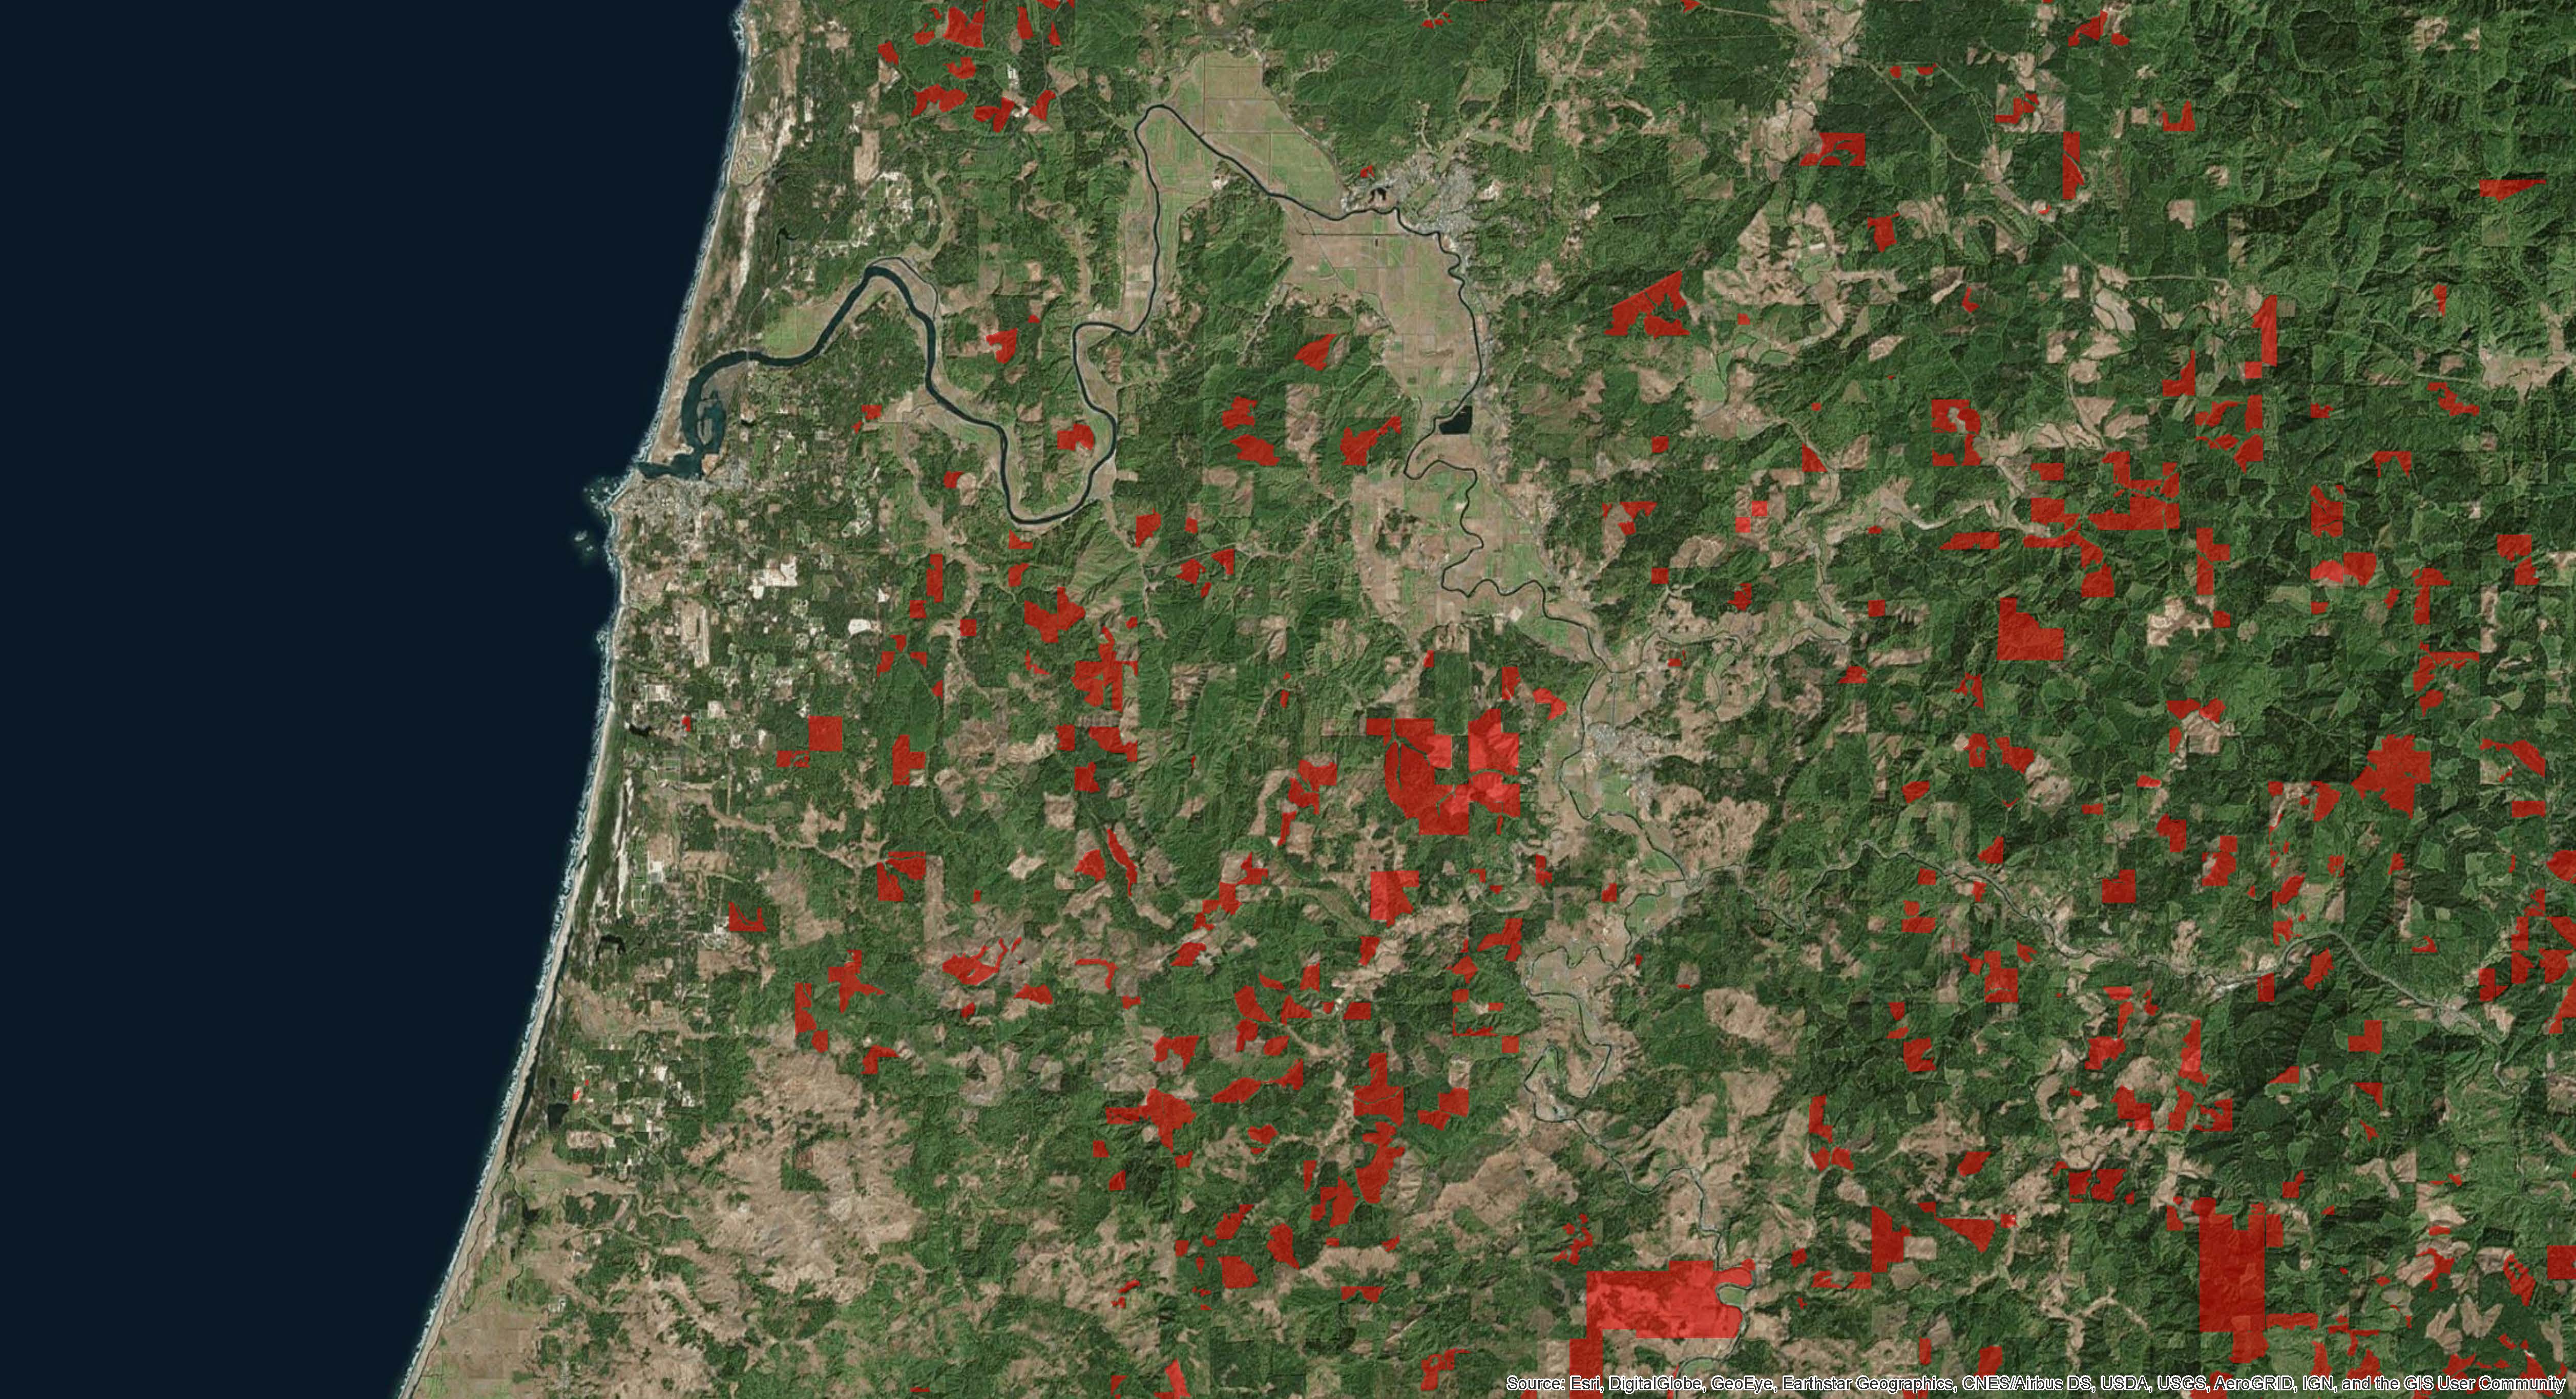
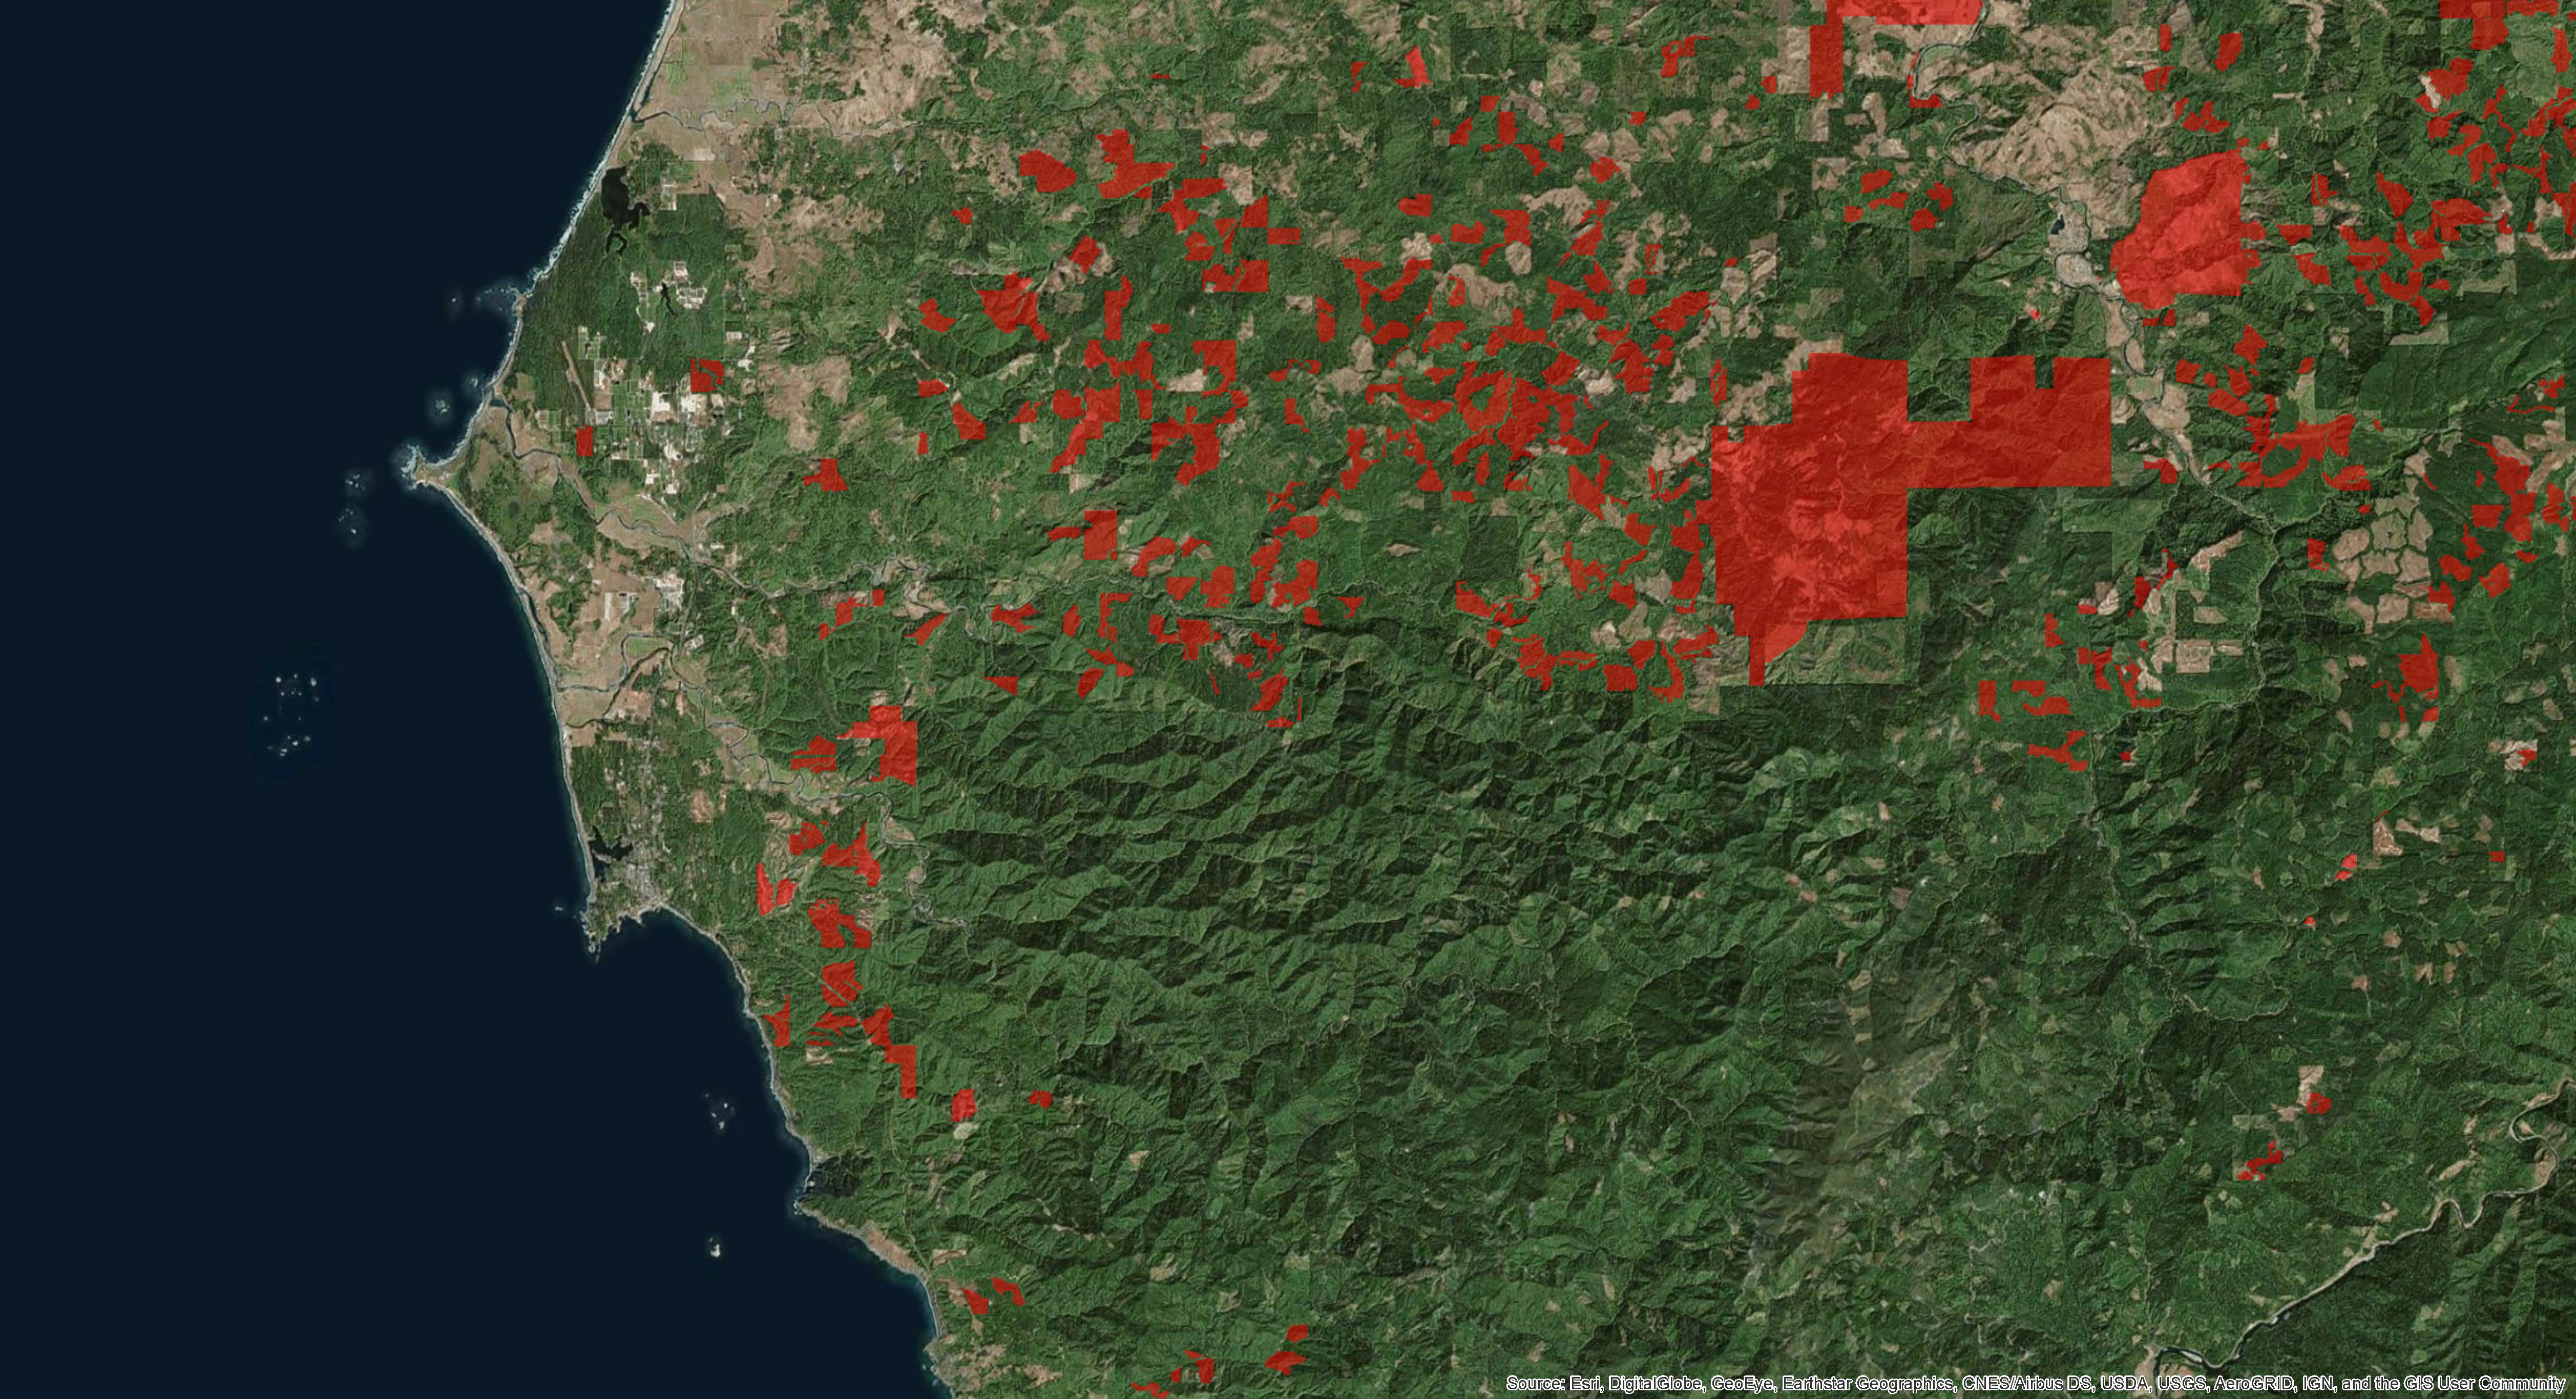
The maps below indicate all spray events (shown in red) that have occurred from 2014-2017 in cities along the South coast.